
With the release of Nutanix Files 3.5 (formerly known as AFS, Nutanix Acropolis File Service) Nutanix introduced a new tech preview feature called Nutanix File Analytics, which provides data and statistics about the operations and contents of a file server. Audit trails and anomalies detection made simple and fully integrated with Prism.
Once deployed, Files adds an Analytics VM to the Files cluster. A single Analytics VM supports all file servers in the cluster; however, you must enable Analytics separately for each file server. Data on the Analytics VM is protected, and is kept in a separate volume group. As of today it’s not possible to support multiple file servers from different clusters with a single Analytics instance, however maybe this will change when the File Analytics feature becomes GA, at this time it’s still in technical preview and should not be used in a production environment.
After deploying Analytics, a new File Analytics link appears on the file server actions bar. You can access Analytics through this link for any file server where it is enabled. The Analytics web console consists of three tabs that include the following options:
- Dashboard: View widgets that present data on file trends, distribution, and operations.
- Audit Trails : Search for a specific user or file and view various widgets to audit activity.
- Anomalies: Create anomaly policies and view anomaly trends.
Deploying File Analytics
The deployment of File Analytics is quite straight forward and simple as you expect it to be from Nutanix.
Make sure to log in into Prism with a cluster admin account.
- Download the QCOW2 and JSON files from the Downloads Portal.
- In Prism, go to the File Server view and click the Deploy File Analytics action link.

Deploy File Analytics - Upload installation files.In the Upload installation binary section, click on the upload the File Analytics binary link to upload the File Analytics JSON and QCOW files.

Upload installation binary - In the available versions section, click the Install button.
- Configure the Analytics VM parameters. If the selected network is Unmanaged, enter additional network details in the Subnet Mask, Default Gateway IP, and IP Address fields as indicated.

File Analytics settings 
Advanced settings
After a couple of minutes your File Analytics VM is up and running and you are ready to enable File Analytics for you Nutanix Files instance(s).
- In the File Server view, select the target file server and click File Analytics in the tabs bar.
- In the Enable File Analytics dialog-box, enter the credentials as indicated. The File Analytics server crawls trough the files and collects data. It needs file server admin user credentials for this task, so the corresponding user account has to be assigned the file server administrator role to an Active Directory (AD) user.

Enable File Analytics
With the initial release of File Analytics 1.0.1 there is a known issue in case your DNS FQDN and NETBIOS domain name don’t match (eq. FQDN is mydomain.com and NEBIOS is MY. In this scenario you won’t be able to configure the SMB authentication and always get a mismatch error about the admin user not belonging to the configured domain. This issue will be solved in an upcoming release, in the meantime Nutanix Support should be able to provide you with a hotfix.
After successfully enabling Files Analytics it will start crawling all the files on your file server. Depending on the number of files and shares this will take some time.
To launch the File Analytics from Prism, go to the File Server view, select the target file server and click the File Analytics action button below the entity table.

Dashboard
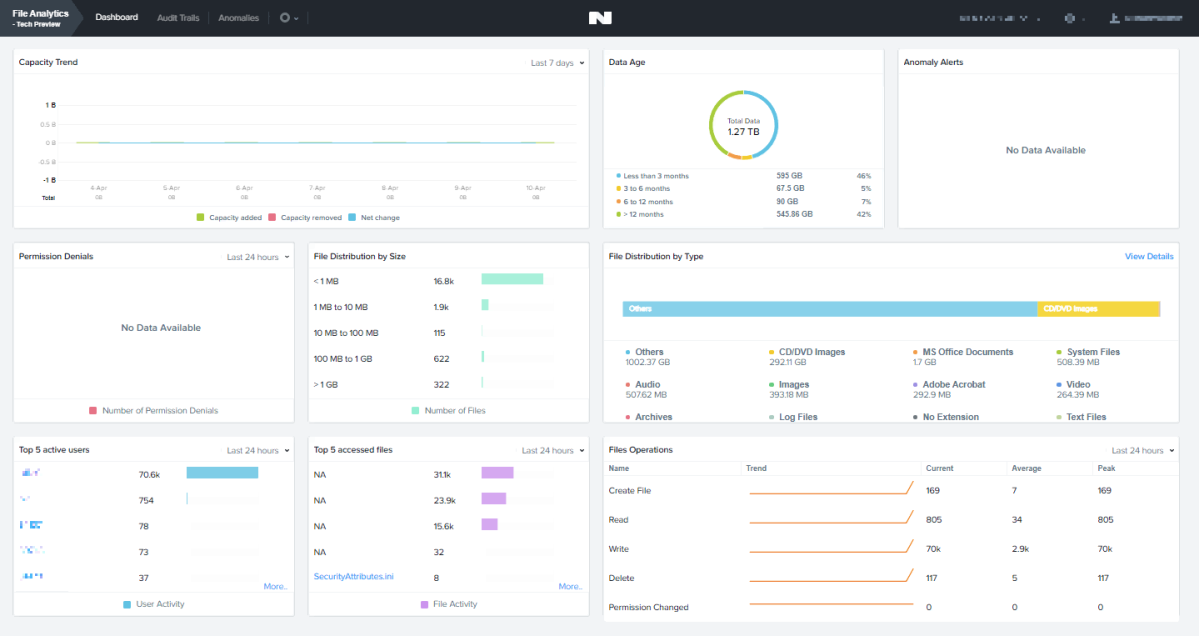
The Dashboard tab is the opening screen that appears after launching File Analytics from Prism.

The Dashboard tab consists of multiple panes that present various analytics data for the file server. It displays
- capacity trends for the file server including capacity added, capacity removed, and net changes
- the percentage of data by age
- alerts for configured anomalies
- users who have had access permission denied and the number
- the number of files by file size
- the space taken up by various applications and file types
- top 5 active users
- top 5 accessed files
- the number of times operations have been performed during current and peak intervals and average operations over the selected period
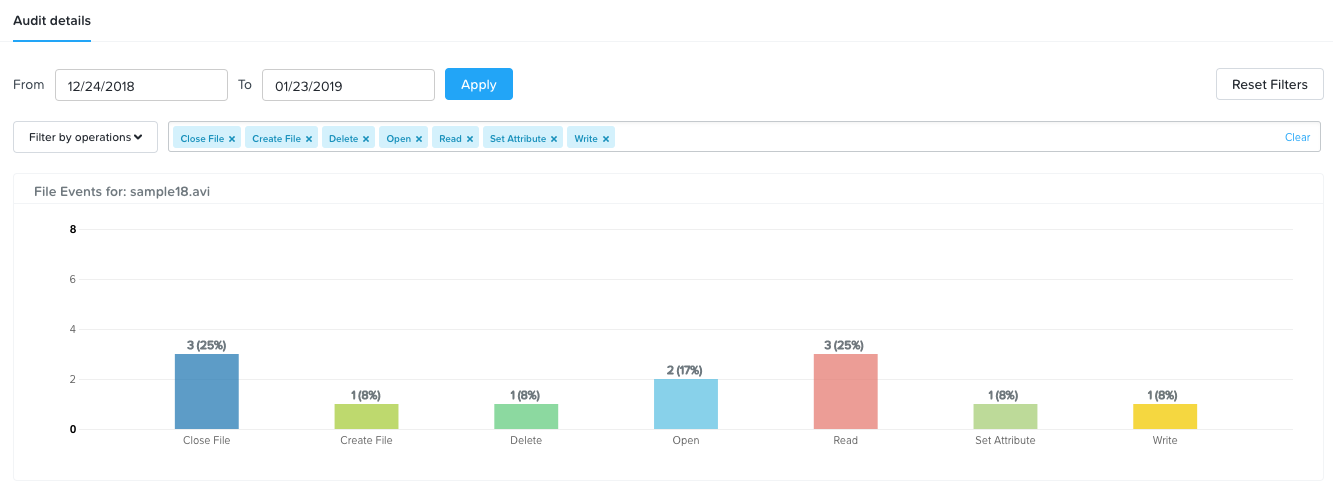
Audit Trails
Use the Audit Trails feature to look up operation data for a specific user or file. The Results Table provides granular details of the audit results. The following data is displayed for every event.

The Results Table provides granular details of the audit results and displays User Name, User IP Address, Operation, Operation Date, Target File and allows the download of the data as a xls, csv, or JSON file.

Instead of searching by user, it’s also possible to audit a specific file.

Anomalies
Data panes in the Anomalies tab display the following data.

You can configure Anomaly rules for creating, deleting and permission changes of files and directories based on conditions for users exceeding operation count/percentage threshold. This allows you for example to generate an anomaly alert when a single user deletes a lot of files.

That’s it – there you have your Nutanix built-in file analytics tool to give you some insights on what’s going on in your file server environment. Keep in mind Nutanix Analytics is still in technical preview and it might change until GA.
One thing I missed is the lack of support for multiple Nutanix Files instances residing on different clusters. Another one I’d like to see in a GA release is the possibility to specify which file shares analytics should track. At this time I found no way to crawl only certain shares or even folders of a files instance. However, for a first technical preview the feature set, its simplicity and the GUI design is quite impressive.
